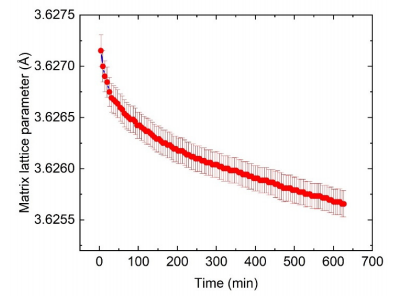
Figure 4. Time dependence of the matrix lattice constant, acquired from the in situ XRD measurements at 700 ◦C. We observed a monotonic decrease in the lattice parameter, indicating that heavy elements such as Nb and Mo gradually diffuse from the solid-solution matrix and contribute to the nucleation and growth of the δ phase. The uncertainty reported in this figure and hereafter represents one standard daviation unless specified otherwise.
Additionally, the change in the matrix lattice parameter of a solid-solution alloy is associated with the extent of the precipitation [40]. In AM IN625, the difference in the matrix lattice parameters before and after a 10 h heat treatment at 870 ◦C was ≈0.0042 Å [21]. In comparison, the lattice parameter changed by ≈0.0015 Å after a 10.5 h heat treatment at 700 ◦C, suggesting significantly less precipitation of the δ phase at this temperature.
IN625, as designed, is a single-phase alloy where the strength mainly originates from the solid solution strengthening from Mo, Nb, and Cr [1]. Whereas the depletion of Mo and Nb from the matrix is expected to reduce the strength, the formation of precipitates can compensate for this reduction and increase the overall strength of IN625. For example, wrought IN625 reaches its peak hardness after a 170 h heat treatment at 700 ◦C, which is mainly due to the precipitation of the γ” phase, a precursor to the δ phase [41]. Similarly, precipitation of the δ phase also increases the overall strength and reduces the ductility [37]. For AM IN625, a systematic evaluation of the effect of heat treatment on mechanical properties over a range of temperatures is required and needed.
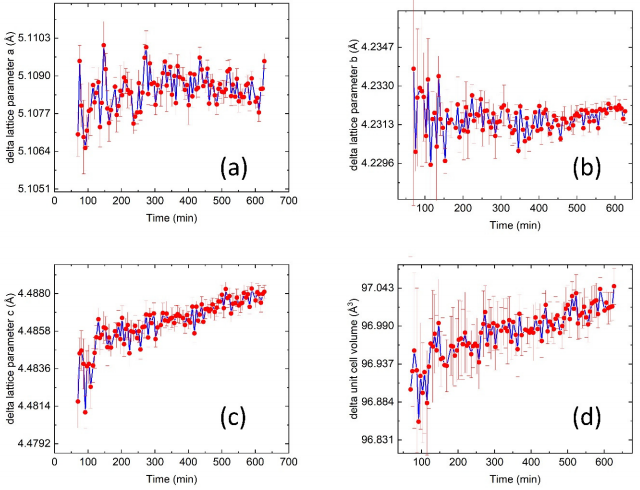
During the heat treatment, the unit cell of the δ phase also changes. Figure 5 illustrates this change. Among the three orthorhombic lattice parameters (Figure 5a–c), two are nearly constant at ≈5.108 Å and ≈4.232 Å, respectively. The third lattice parameter shows a monotonic increase from ≈4.482 to ≈4.488 Å. It is known that the long axis of the δ phase aligns with the close-packed directions of the FCC matrix, and the crystallographic orientations between the FCC matrix and the δ phase follow {111}FCC//(100)δ and FCC//[100]δ [10]. Based on this, we infer that the diffusion of Nb and Mo is also directional. Since Mo diffusion from the matrix to the δ phase occurs more slowly than that of Nb [42], this directional diffusion may lead to a change in δ phase chemistry and an increase in the unit cell volume, as shown in Figure 5d.

Figure 5. (a–c) Time dependence of the three lattice parameters of the δ phase precipitates, acquired from the in situ XRD measurements at 700 ◦C. (d) The volume of the unit cell of the δ phase precipitates.
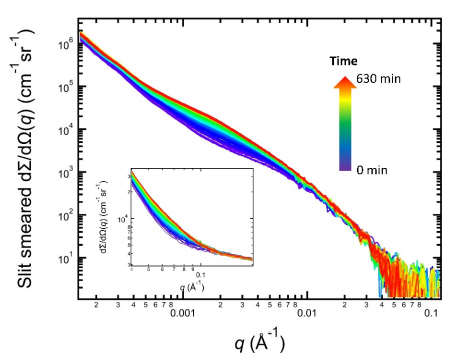
In situ SAXS data acquired with the same sample volume during the isothermal heat treatment also provide a window to probe the statistically significant transformation kinetics of the material’s microstructure. Figure 6 shows the complete dataset, with USAXS data being the main plot and the SAXS data shown in the inset. For consistency, the scattering data are color-coded using the same color scale as the XRD data in Figure 3. The scattering data have three noticeable characteristics. First, for the very low-q part of the scattering data (≈1 × 10⁻⁴ Å−1 to ≈4 × 10⁻⁴ Å−1 ), we observed a power-law slope that does not change as a function of time. We attribute this feature to the grain scattering, which is similar to previous work on Ni-based superalloys [21,43] and aluminum alloys [44,45]. The grain growth in IN625 is minimal for temperatures below 900 ◦C [46]. Hence, the grain scattering is expected to be stable, which is consistent with experimental observations. Second, we observed a monotonic increase in scattering intensity between ≈4 × 10⁻⁴ Å−1 and ≈0.01 Å−1 , notably with two Guinier regions near 2 × 10⁻³ Å−1 and 8 × 10⁻³ Å−1 , respectively. Since the in situ XRD data and ex situ SEM images only show the δ phase precipitates, we attribute this scattering signal to the δ phase. Previous microscopic studies have established that the δ phase precipitates are platelets with two characteristic sizes [10,21,47], which is in agreement with the observation of two Guinier regions in the scattering data. Lastly, the SAXS data shown in the inset are simple extensions of the high q power-law slope in the USAXS data; i.e., the SAXS data contain no additional information, which indicates that no additional nm-sized precipitates formed during this heat treatment.

Figure 6. In situ SAXS data of AM IN625 acquired during isothermal heat treatment at 700 ◦C for 10.5 h. The main plot and the inset show the USAXS and SAXS data, respectively. The acquisition time is color-coded following the time arrow. The USAXS intensity is slit-smeared.
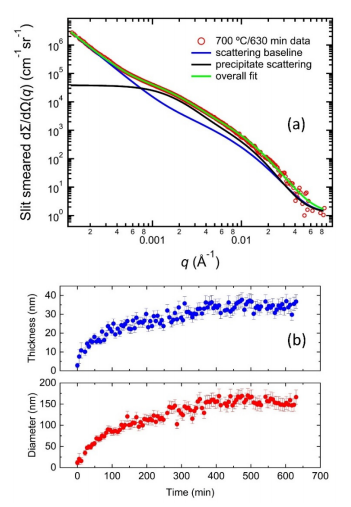
We constructed a scattering model to describe the scattering data based on these observations, as illustrated in Figure 7a. Using the USAXS data acquired at 630 min into the in situ experiment as an example, this model consists of two components. The first component is the scattering baseline, which is obtained on the same sample volume at room temperature before the heat treatment. The second component represents the excess scattering originating from the δ phase precipitates. As established previously [21], we described this excess scattering using an analysis approach analogous to the unified smallangle scattering method with two scattering levels [48]. Together, this two-component model describes the in situ SAXS data well through the entire data sequence.

Figure 7. (a) An illustration of the SAXS model used in this work. The data were acquired at 630 min during the heat treatment at 700 ◦C. The overcall scattering comprises two parts: (1) scattering baseline and (2) excess scattering from the δ phase precipitates. (b) The time-dependent evolution of the mean diameter (major dimension) and thickness (minor dimension) of the δ phase precipitates.

